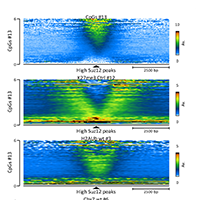
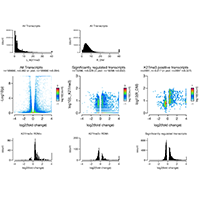
Session files for published figures
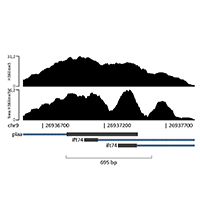
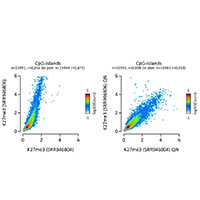
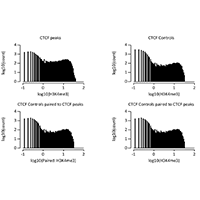
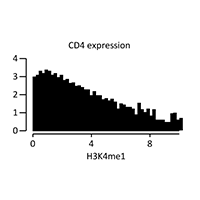
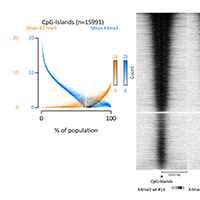
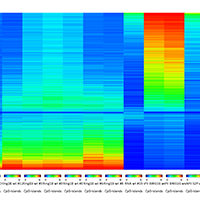
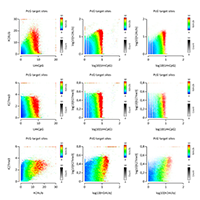
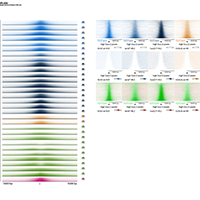
Below are links to a several session files that will generate the figures used for our NSMB paper introducing EaSeq and visualizing Polycomb data, as well as an earlier paper where we used EaSeq to integrate transcriptional data and ChIP-seq. The plots in the papers were edited after being exported from EaSeq, and not all plots and settings were saved originally, so some session files had to be remade. The plots in EaSeq might therefore look different from those in the paper.
Some of the files are quite large and will take a while to download. Therefore, some smaller session files with no or less raw data are also available.
From Lerdrup et al, NSMB 2016:
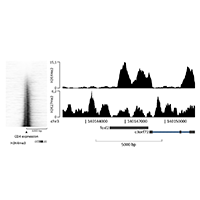 Figure 2 [438 MB] (This session also contains all datasets from Barski et al downloaded from this site)
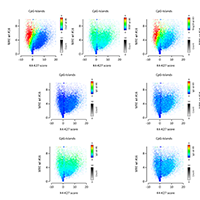 Figure 6d [4300 MB] (Contains many mESC datasets mapped to mm9, see this table for a list)
From Södersten et al, PLOS GEN 2014:
