Features
See also our Paper, Poster, Handout and demo video
Made for biomedical scientists
- Graphical user interface
- Point and click with pervasive visualization
- Runs on an ordinary Windows PC
- Self-contained
- Versatile
- Free
Tightly integrated
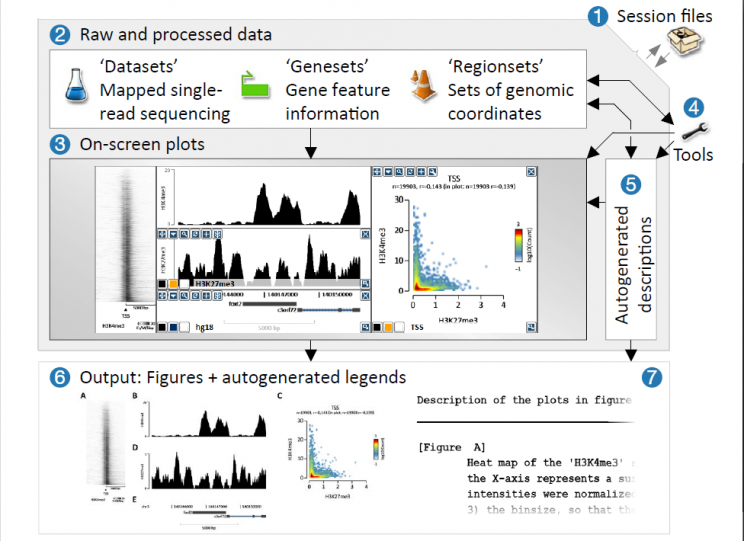
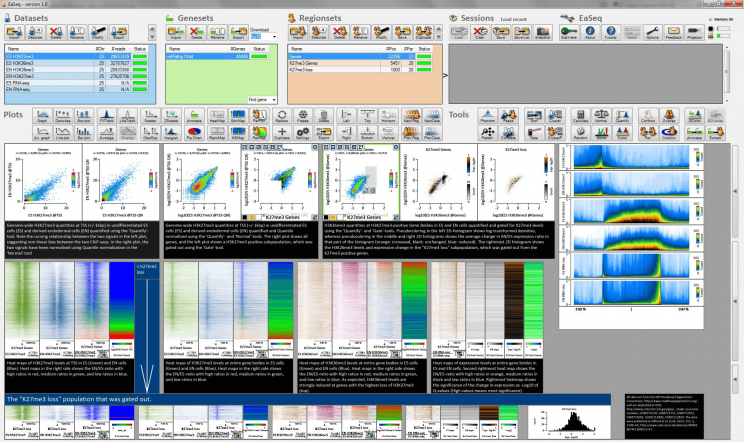
- Build up figures that link to genomic loci.
- Organize data into exchangeable session files (1) that ties raw data (2) to plots (3).
- Fully integrated tools (4) accellerates work.
- Limits file -reformatting and -export.
Autodocumenting
- EaSeq automatically records each step (5).
- Exported figures (6) can be enumerated.
- Autogenerated legends and methods (7) are exported along.
Highly interactive
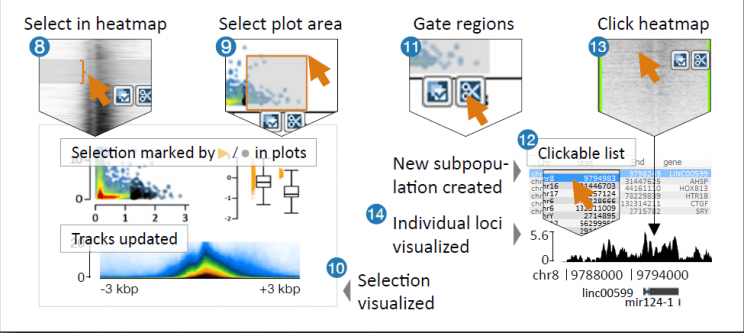
- Loci from heatmaps (8) or plots (9) can be visualized in other plots and tracks (10).
- Subsets of regions can be gated into new sets (11).
- Lists (12) and heatmaps (13) can be used to inspect individual loci ensuring that interpretations match underlying signals (14).
Examples in the videos here and here
Comprehensive toolset
Import wizard, Tutorial, File conversion, Dataset -merging, -resampling or -down-sampling, Make subsets of genes based on region proximity, Extract regions from genome, annotate regions, Overlap gene lists, Find region overlaps or exclusions, Colocalize, Generate matched control regions, Analyse overlap, Cooccurrence, Pair regions based on parameter similarity, Score regions based on distributions, Scramble or generate random parameters, Calculate parameters, Normalize parameters (3x), Quantify signals at regions intuitively, Cluster regions based on parameters (k-means or Heirachical), Cluster regions based on signal (k-means or Heirachical), Gate regions based on parameters, Sort regions based on parameters, Correlate datasets globally, Peak-finding (2x), Pattern-seeking, Quality control and DNA-fragments size discovery (Phantom peak), each tool comes with a variety of easily adjustable options.
More here and in the paper here
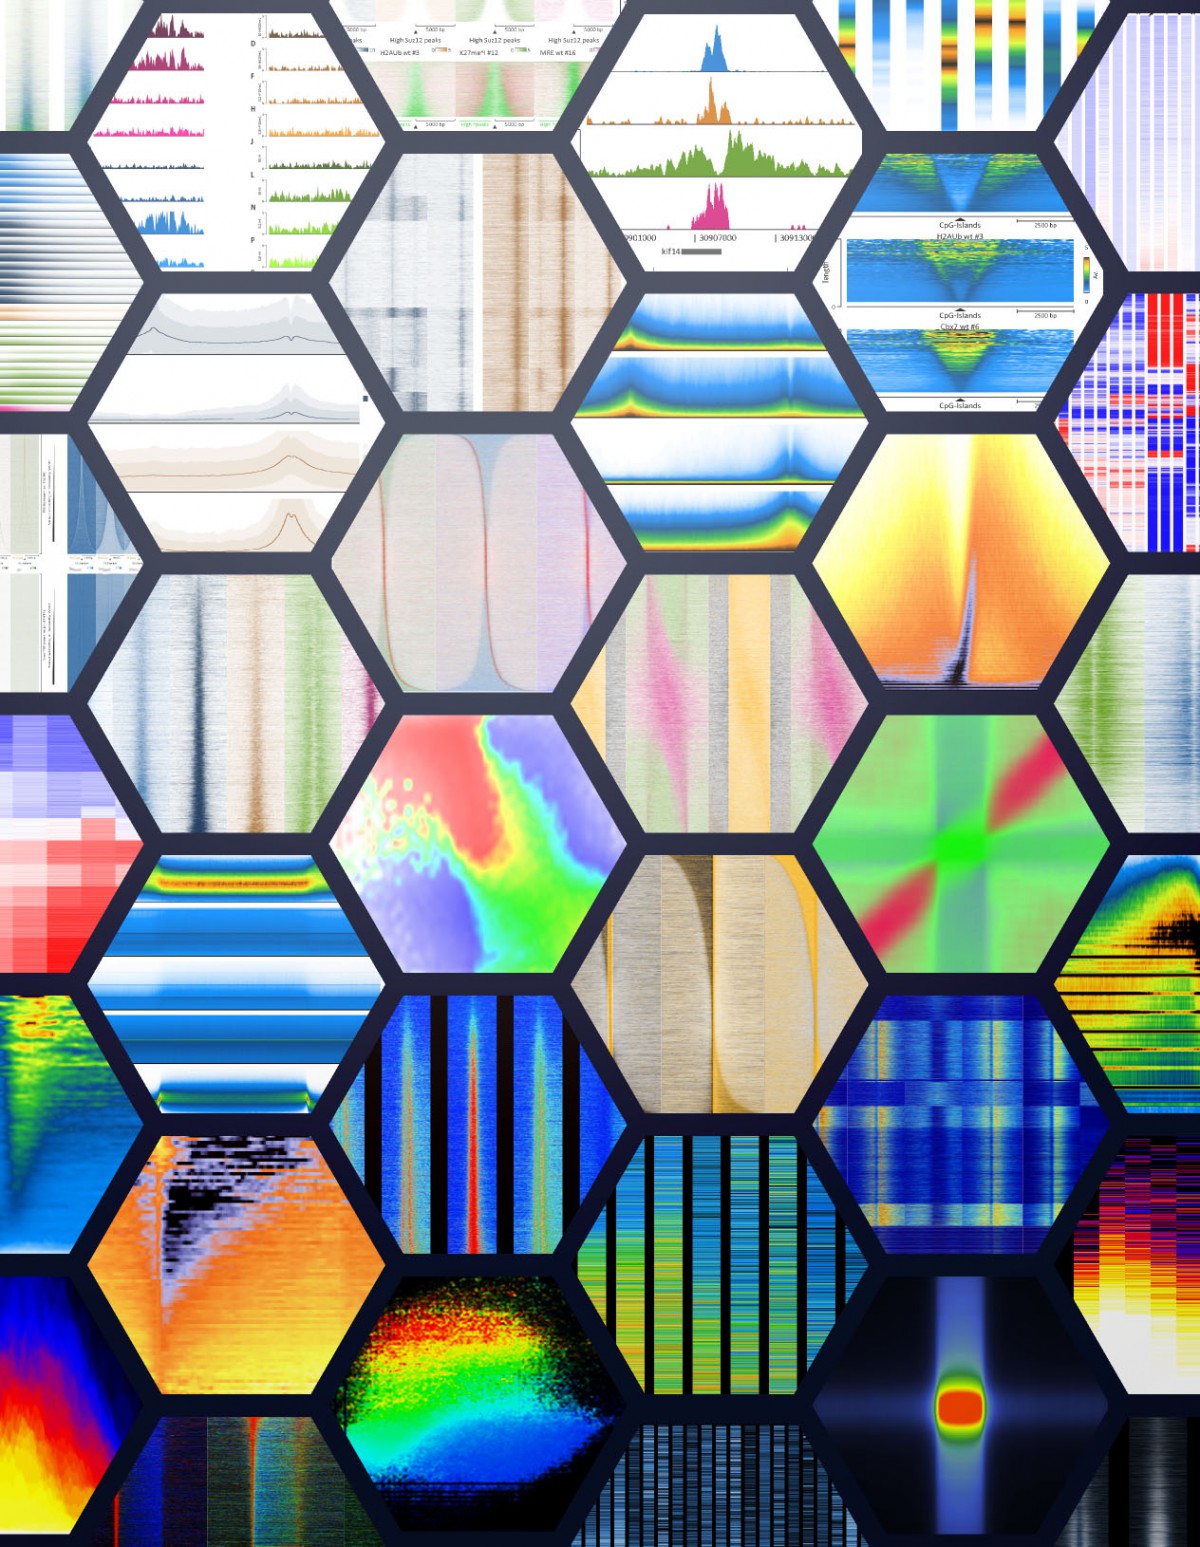
Visual
An abundance of different visualization types: Graphs, Average Graphs, Density plots, Bar plots, Line plots, Box plots, Pie charts, Wenn diagrams, Filled track, Open track, Average track, Superimposed track, Highlighted track, Annotation track, XY-scatter, Pseudocolored scatter, Obs/Exp scatter, Histogram, Heat map, Highlighted heat map, Ratiometric heat map, Sorted heat map, Normalized sorted heat map, Parameter plot, Parameter heat map, a wealth of plot adaptation options, tracks and maps can be absolute or relative.