v1.04: PDF export and other plot improvements
v1.04: PDF export and other plot improvements

v. 1.04 is out, and while it might not be obvious at first glance, much was changed under EaSeq’s hood when going from version 1.03 to 1.04.
The three most important improvements are:
1) Export plots as pdfs.
I had to make a substantial redesign of the algorithms underlying the plotting part to allow support for pdf output.
The new version has been throughoutly tested and debugged for a couple of months, and to my knowledge, the plots perform as intended. If you do find differences from the older versions, then please let me know, but beware of the other changes mentioned below under 3.
I owe a lot of thanks to the authors of the code library called PDFsharp for making this possible.
Although pdf output is fully functional, I’d prefer to keep it in the beta-section so far, while I gather your experiences. To output plots as pdfs, you will therefore need to maximize the ‘Beta’ panel first, by clicking on this button:
![]()
2) Plots now visualize logarithmic values of zero and subzero values better.
Whenever presenting log transformed data in a plot, I run into a problem when values are zero or below. The logarithm of zero or below returns a nonnumerical value, and the initial way of handling this in EaSeq was to assign the value zero to the final output.
This often resulted in an accumulation of values at the zero positions in e.g. XY when visualizing parameters containing negative values in scatters or histograms using log-scales. This has bothered me a for a while, but I could not settle on how to handle this in the best manner.
As shown in the figure below, then these numbers will not be included now in the plot, unless you check the ‘Include all’ (formerly known as ‘Include outliers’) checkbox in the setting for the plot(s). When this box is checked, then log(=<0), non-numerical values, values below the visualized range (the values on the axis) will pile up at the position of the lowest value on the axis. Values above the visualized range will still pile up on the position of the highest value on the axis (not shown).
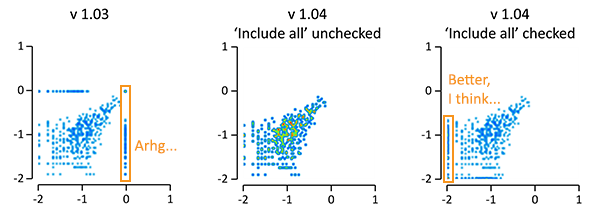
This changes the default behaviour of EaSeq, and many plots will therefore look slightly different. If you for the sake of consistency prefer the old method, then I recomment keeping 1.03 or running both 1.03 and 1.04 (or future versions) from separate folders. I have tested and bugfixed the new behaviour on a lot of existing session-files that I use, and to my knowledge then the behaviour is now consistently changed for all plot types that can present logarithmic values from ‘Region Parameters’. If you experience the opposite, or if you have suggestions for further improvements on this, then please let me know.
3) New plot coloring schemes have been added.
App. 40 new color schemes, which are sometimes also known as Pseudocoloring, Color scales, and LUTs, can be found in the ‘Color Scheme’ selection in the plot settings.
The main reason for providing these new options is to provide figures that are more friendly for colorblind people, and to provide some color schemes that are more perceptually uniform – rainbow coloring has been rightfully critized for potentially distort and confuse readers. The autogenerated descriptions and legends have been updated to contain information on how to cite/credit the originators for the coloring schemes when they are used. My suggestion would be to use these new 40 schemes rather than the original 30 schemes. You can read more about why and get good advices on visualization here, here, here, here, here, here, and here.
Please be aware that older sessions can be imported in version 1.04 and updated to use the new color schemes, but if a session using the new schemes is imported into an older version of EaSeq, then the plot(s) will show an error message until you go into settings and change the ‘Color Scheme’ to one of those supported in the older versions of EaSeq (generally numbered from 0 to 30).
Finally, the update also includes lot of minor improvements and fixes. You can read more about those here.
I would like to express my gratitute to the users who have provided feedback, suggestions, and bug reports.
Happy Birthday, EaSeq New features for beta testing